Where to find your transactions data
Your Splitit Merchant Hub contains all the transaction data for every order that went through Splitit — plan length, order value, timing, and installment status. This tells you what’s happening inside your installment activity.
What it can’t tell you is what’s happening outside it. The Hub doesn’t have visibility on orders paid in full or through other payment methods. To get the full picture, you need to combine your Splitit Hub data with your e-commerce platform analytics — Shopify, WooCommerce, or whichever platform you’re running on.
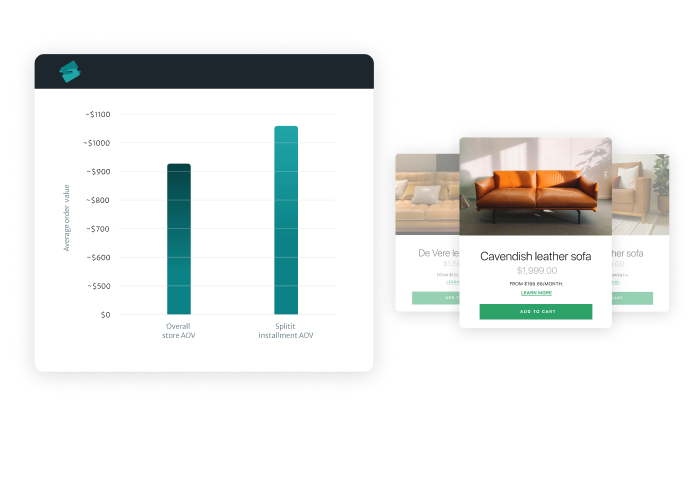
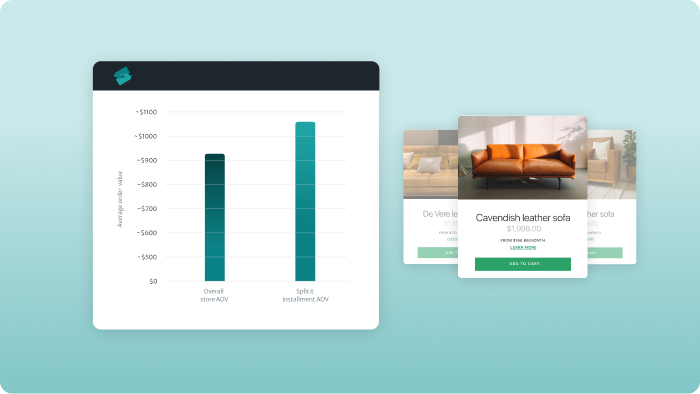
Installment AOV vs Total AOV
Pull your average order value for Splitit transactions from the Hub and compare it to your overall store AOV from your e-commerce platform. If installment orders are higher, that represents the direct uplift installments are generating on transaction value. Splitit merchants see an average increase of 23%.
If your average order value is below expectation, take a look at our guide on how to increase AOV with installments.
Conversion rate (before and after)
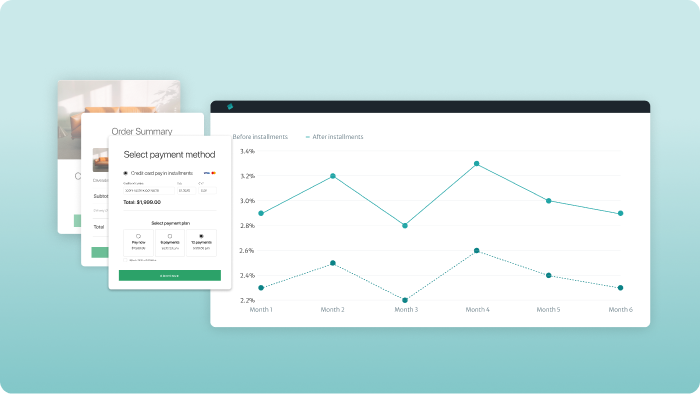
Your e-commerce platform tracks your overall conversion rate. If you have data from before installments were live, or before promoting them, compare that period to now. Keep the comparison period consistent and account for seasonality.
Splitit merchants see an average 27% increase in conversions when pay-later is built directly into the checkout with no redirects.
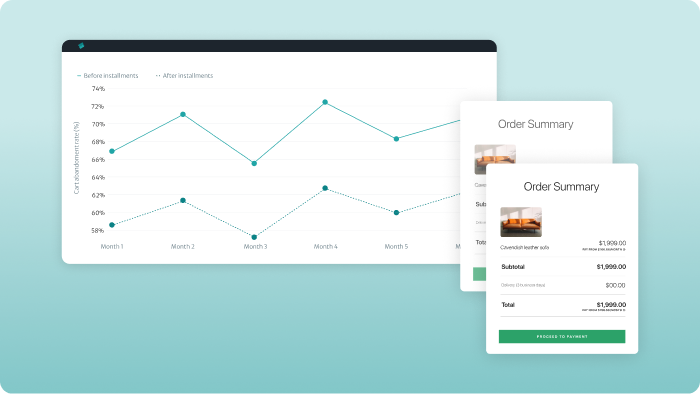
Cart abandonment rate
Your e-commerce platform will show cart abandonment rate over time. As with conversion rate, compare a period before installments were live against the same period after, keeping seasonality in mind. Splitit merchants see an average 12% reduction in cart abandonment. If your abandonment rate hasn’t moved, take a look at our guide on how to reduce cart abandonment with installments.
Measuring CLV impact
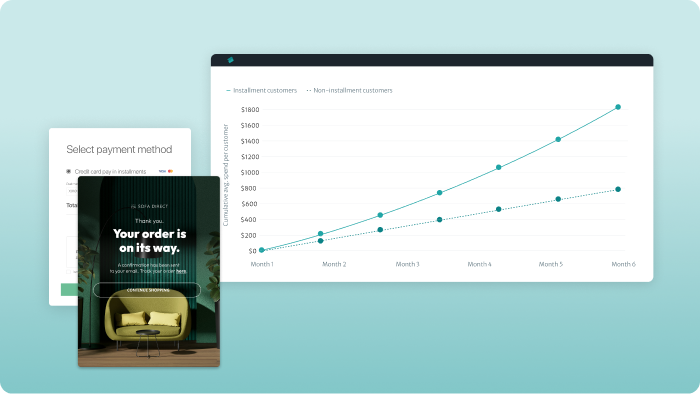
Impact on Customer Lifetime Value (CLV) requires looking at behaviour over time — whether installment customers come back more often and spend more across multiple purchases.
Your Splitit Hub will show you repeat installment transactions from the same customers. Cross-reference this with your CRM or email platform to understand how installment customers behave compared to your wider customer base — repeat purchase rate, time between purchases, and total spend over 6 or 12 months.
This takes longer to measure. You need at least six months of data to start seeing patterns, but it’s the number that makes the strongest case for installments as a long-term growth tool rather than a checkout feature.
Running before and after comparisons
The most reliable way to measure the impact of installments is to compare a period before they were active — or before you optimised their visibility — against the same period after. Use your e-commerce platform for store-level metrics and your Splitit Hub for installment-specific data.
A few things to get right:
- Use equivalent time periods. Comparing November to February will tell you nothing useful. Match the same weeks or months year on year, or use a long enough window — at least 60 days — to smooth out short-term fluctuations.
- Keep other variables constant where possible. If you’re running a major promotion or driving significantly more traffic during your measurement period, it becomes harder to isolate the installment effect. Measure during a steady trading period where possible.
- Look at trends, not snapshots. A single month is rarely enough to draw conclusions. Look at whether AOV, conversion rate, and abandonment rate are moving in the right direction consistently over time.